1. Script loading

s" test_he.jpg" loadimage cr

                    -20 bright cr

                    6 radial cr

                    11 smooth cr

                    319 236 40 flood cr

                    togray cr

                    0 43 thresh

                    cr inv cr

                    1 border cr

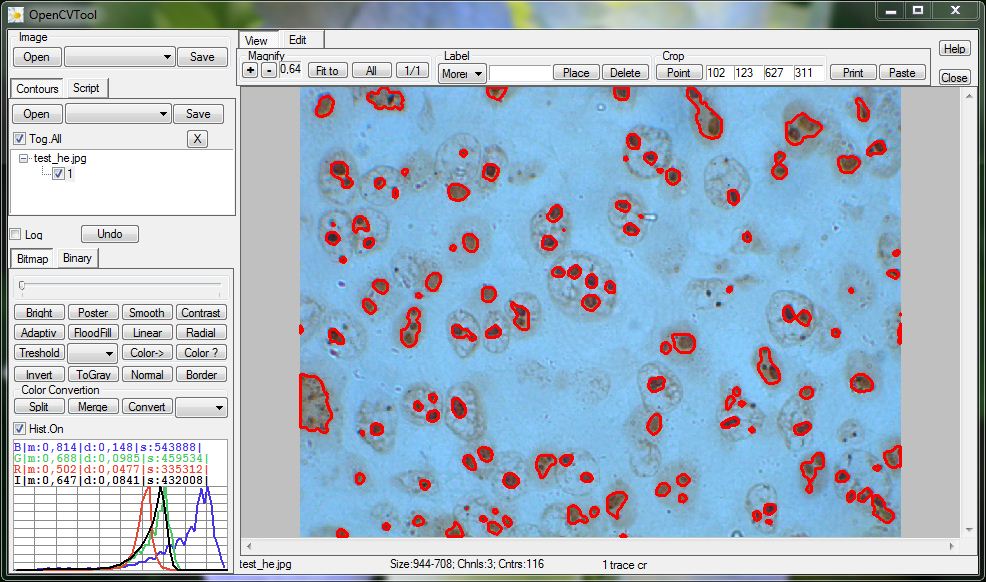
                    1 trace cr
2. Open the image

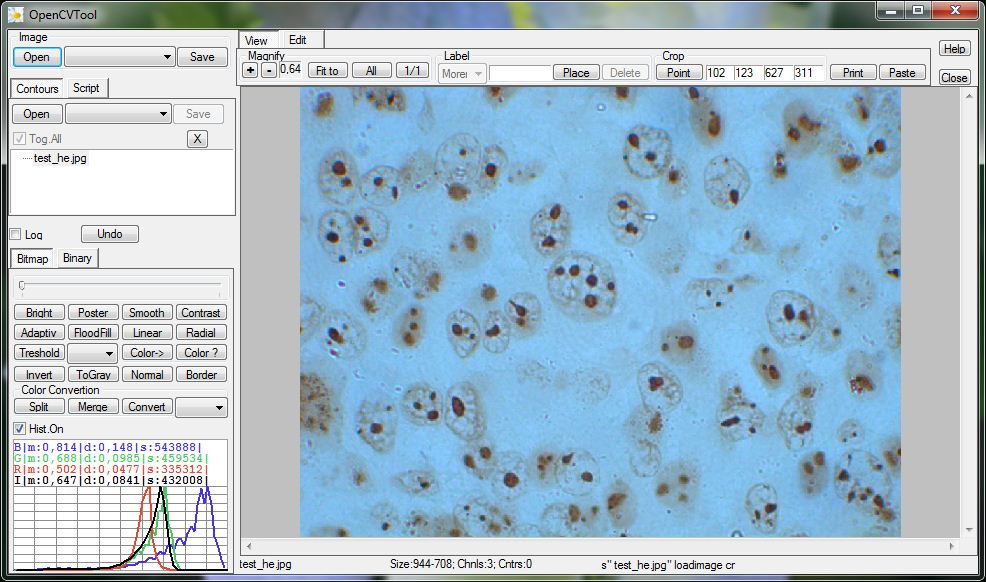
We've executed :
s" test_he.jpg" loadimage cr
It is helpful to see how a histogram of the image is changing during
our work. Check the Hist.On box if not checked. For the true color
image this shows four histograms - 3 color channels(RGB) and the one (black) for
the intensity or just one curve for a gray scale image.
3. Is lighting uniform?

4. Tracking

-20 bright cr
It slighltly decreases image brightness. The aim of this operation
will be clear on the next step. Click the Bright button on the Bitmap
tab. By this button the program goes into tracking mode. This mode is ended
by a Left mouse click and canceled by a Right mouse click. Now move
the mouse pointer horizontally. During mouse tracking look at the Status line
on the bottom right where all parameters of the currently issued command will be
printed. We need to select the -20 bias. When it is riched - click the Left
mouse button or the Right mouse button for canceling and try the operation
again.
6 radial cr
use the Radial button and track the mouse horizontally for
the case when strength parameter will be a 6 or so.
Every image has intensity fluctuations or noise. To eliminate them, use the Smooth button. As usual, the left mouse button to accept operation, the right - for cancel. We've made
11 smooth cr5. Flood fill the background

500 358 40 flood crthe first two numbers are XY coordinates of a seed point for the flood filling. The last one is the strength. After clicking the button, click somewhere at the background, and select proper parameter by tracking a mouse. We could also execute this complicated command from the script console. To issue a command without mouse clicks and tuning, go to the Script tab, type the command in the field (or paste it from the Notepad if you are lasy) and hit Enter to execute it.
6. Thresholding

togray cr

                0 43 thresh cr
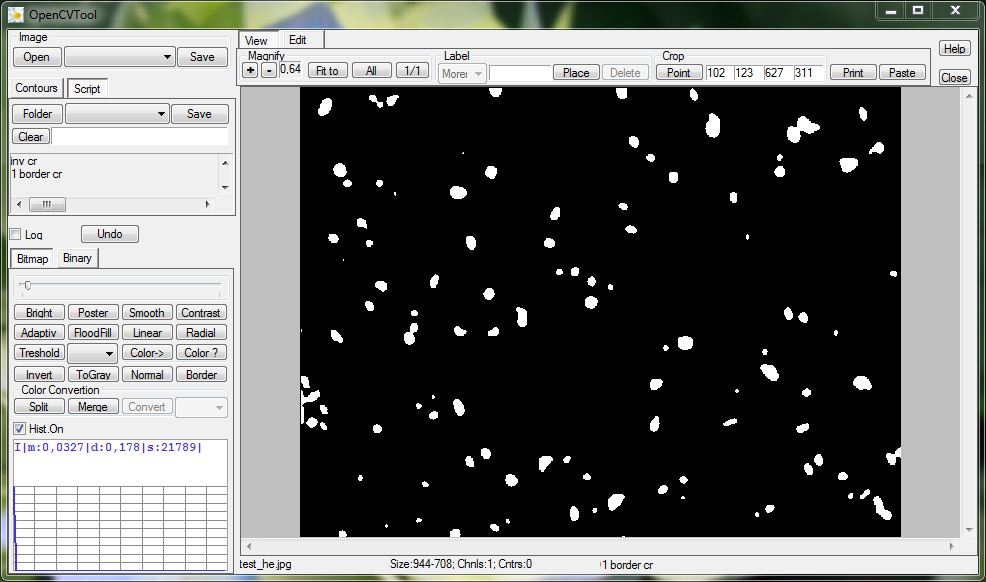
We see black blobs on a white background and could apply the tracing. But we should do other two steps for separating the blobs from the image border. Click the Invert button and use the Border tool to draw a black border around the image.
inv cr

            1 border cr
7. Tracing

Lets look at the histogramm footer. There are four lines. The Area with the mean area of the 380 sq pixels,the Len with mean perimeter length is 64.7 pixels, the nonconvexity Defect (25.7 sq pixels) and the first Eccentricity (mean is 0.0283). The second number is a deviation. The last one is the sum of correspondent values.